Piketty and some megatrends of a non-sustainable world:
Lessons from a numerical simulation exercise
A few years ago French economist Thomas Piketty published his magnum opus, Capital in the 21st Century. In this important book Piketty argues that historically the rise and decline of inequality has been determined to a large degree by the relationship between rates of return on assets, r, and the rate of growth, g. The reason is straightforward: If the average investor’s fortune increases by, say, 5 per cent per year whereas GDP grows by 1 per cent per year, investors’ fortunes will tend to rise as a share of GDP. Thus, with constant rates of return, there is a built-in tendency for inequality to rise – much as in a game of Monopoly. Many such games end with a whimper when the losers leave the table stripped of their assets. If capitalism were to end this way, it would more likely do so with a bang, however, and to avoid this prospect and rescue capitalism from itself, Piketty recommends progressive taxation on a global scale.
In this blog post, I wish to consider some possible reasons why growth rates have declined and income inequality risen, illustrating my argument with simulated data. At the heart of the argument is a simple resource economic model of the world economy. As will be shown below, the model suggests that a green transition is as imperative as progressive taxation if we are to avoid the fire and fury of a global big bang.
The theoretical model – premises of the argument
The Earth is blessed with enormous – but not inexhaustible – natural resources. Mankind uses its labour power to exploit these to produce the tools and machinery and other goods and services that make up its real income.
Let
- Nt denote the stock of natural resources at date t
- nt be resources entering into production at date t
- nmax,t be the maximum amount of resources that may be extracted at date t
- Lt be the labour power used at date t.
- Tt be the (average) level – or factor productivity – of the technology employed
- k be a constant
Furthermore, let global output be given by a constant elasticity of substitution (CES) production function.

As ecological economists would point out, the relevant elasticity of substitution is likely to be numerically low. It takes flour, labour power and other ingredients in nearly fixed proportions to produce bread[1]. The right proportion depends on technical change, however. Note that in (1) resource efficiency is assumed not to increase with technical change. Unfortunately, this assumption is broadly consistent with the empirical observations over the past decades.
For simplicity, it is assumed that the maximum amount of resources that can be extracted per period is

The supply of these resources is given by a concave, elliptic, iso-cost curve

The evolution of the world’s population, P, is given by a logistic growth curve mimicking global population development. It starts at 2.5 in 1961, reaches 7.8 by 2020 and tapers out at 12. This is roughly consistent with historical and predicted developments of the world’s population (in billions). The simulation starts in 1950 and runs until 2400, but none of the figures should be taken literally.
Two types of technology, TB and TG are available, B and G denoting black and green respectively. For the sake of argument, let us assume that the initial value of TB is higher than that of TG. to provide incentives for choosing “black” technology. Recycling comes at a cost. However, under the “black” regime the natural resource base is reduced from year to year. Under the green regime, all raw materials used are being recycled.
The real world, of course, is characterized by some dirty combination (TB, TG). I shall assume that

Resource depletion is given by

The exponent φ measures the efficiency with which resources are used. One might expect this exponent to be positive, therefore. However, recent data from the International Resource Panel, UNEP, suggests that over the last decades global resource extraction has outpaced GDP growth, i.e., instead of a decoupling of growth and resource use, the world has actually seen a recoupling. There are several reasons for this. The UNEP mentions the shift of growth from more to less resource efficient economies as well as the resource-demanding build-up of infrastructure as explanatory factors. Also, new extraction technologies may boost the supply of resources and reduce short-term incentives to economize. For present purposes, I shall simply assume that φ = 0.
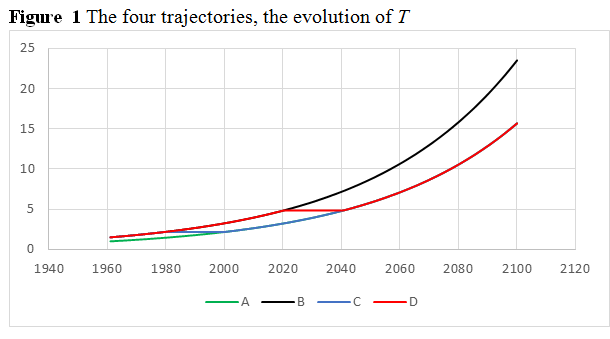
Technological trajectories
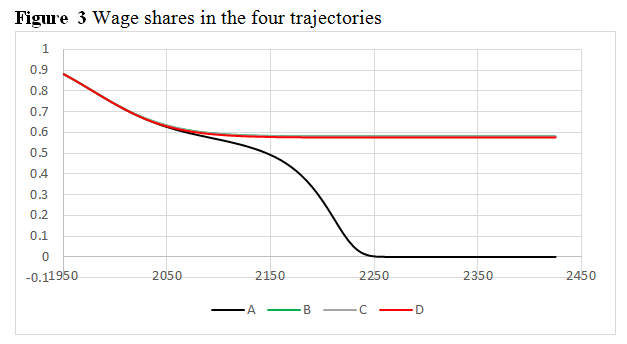
The technological trajectory followed is a result of a series of choices made to develop the two types of technology. In the following, we shall compare four technological trajectories, A, B, C and D. In trajectory A, the world economy sticks entirely to a green technology, whereas in B it stays on a black track. In C it starts out with a black technology and then turns green at a rate allowing T = TB + TG to remain constant during the transition phase. This is also the case in D. However, whereas in C the transition starts in 1980, in D it starts in 2020. I shall define a variable gt (for greening) to reflect the short-term choice made at date t. This variable ranges between 0 and 1. For g = 0 the world turns black, whereas for g = 1 it chooses only perfectly green technologies. More generally, it is assumed that

From a short-term perspective it is always tempting to go for g = 0. Recycling is costly. However, there is some transfer value from black to green and vice versa.
The initial value of TG1961 = 1, whereas TB1961 = 1.5.
Finally, within either of the pure regimes, T grows by two per cent per year, cf. (6) and (7).
Note that under the assumptions of (6) and (7) it takes some 20 years at the same level of factor productivity to turn green. This time frame is highly sensitive to the readiness to accept the ceiling on T. Thus, if T is required to grow by 1 per cent per year, the process takes about 40 years rather than 20.
Based on factor productivity alone, one should obviously stick to the black track. From a long-term perspective this is not advisable, however.
In the simulation shown in Figure 2, the black trajectory stays ahead of the others for quite a while in terms of output (World GDP), but then suddenly collapses. In the real world with its many different types of natural resources and resource scarcities, this is likely to be a more protracted process. Increasingly scarce resources are likely to be exploited or monopolized as it has happened with oil and the formation of OPEC.

In other words, the green transition is a precondition for long-term growth; not vice versa (as it has been claimed in the Danish debate). The long-term choice is not between green and black growth, but between green growth – if the Gods of technical development permit – and black decline.

In three respects, the model’s black trajectory appears to capture mega trends found in the real world.
- Declining growth rates, both in total and per capita
- Decreasing wage shares
- Signs of increasing prices of raw materials (e.g. for steel and copper).
This said, the real world is obviously a great deal more complicated than this sketchy model presented here.
Concluding remarks
It is perhaps trivial to demonstrate that unsustainable growth is – well – unsustainable. The long-run choice is not between green and black growth, but between green growth and black decline. In fact, whether infinite green growth is possible, remains to be seen, but infinite black growth certainly is not.
What seems more interesting is the observation that the relationship between declining growth and growing inequality observed by Piketty may be interpreted from a resource-economic perspective.
Sources:
http://www.resourcepanel.org/reports/assessing-global-resource-use
https://data.worldbank.org/indicator/NY.GDP.MKTP.KD.ZG?end=2017&start=1989
https://traccsolution.com/resources/raw-material-costs/
http://ec.europa.eu/environment/enveco/jobs/pdf/Study%20Resource%20labour%20productivity%20.pdf
http://www.csls.ca/reports/csls2009-8.pdf
http://css.umich.edu/factsheets/us-material-use-factsheet
https://www.sciencedaily.com/releases/2014/05/140507095851.htm
https://journals.openedition.org/sapiens/906
Piketty, T. (2014), Capital in the Twenty-First Century. Translated by Arthur Goldhammer: Harvard University Press, Cambridge, Ma.
[1] In the simulation below the elasticity of substitution is assumed to be εs = – 0.2. This implies that r = εs/(1- εs) = -4.
